Home » Uncategorised »
House Price Growth in the Shetland Islands Matching London
This article is an external press release originally published on the Landlord News website, which has now been migrated to the Just Landlords blog.

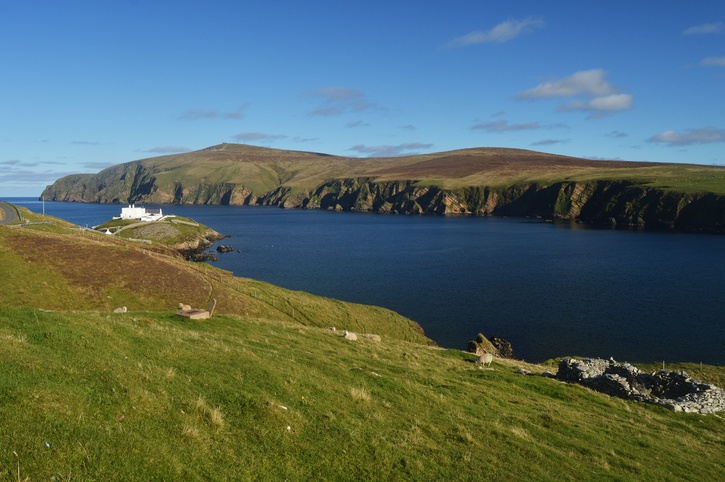
UK house prices may now be starting to stall, but most locations have seen significant growth over the last ten years. An unlikely hotspot is the Shetland Islands, where values have increased by an average of 76.6%, according to HouseSimple.com.
With a population of 23,000, this tiny group of islands has become an unlikely property hotspot, with the average house price rising from £91,740 in 2007 to £161,984 in 2017.
This compares to an average increase of 1.8% across Scotland and 23.4% in England, putting the Shetland Islands among the top ten fastest rising property markets in the UK.
Westminster tops the list, with house prices up by a whopping average of 105.5% over the last decade, closely followed by Hackney, which has seen an average rise of 93.3%.
The Shetland Islands, which has a large oil supply and exports a third of Scottish salmon, is the only region in the top ten fastest growing property markets that is more than 15 miles outside of central London.
Top 10 regions for house price growth between 2007-17
| Position | Region | Average house price – 2007 | Average house price – 2017 |
Increase |
| 1 | Westminster | £514,427 | £1,057,193 | 105.5% |
| 2 | Hackney | £290,397 | £561,275 | 93.3% |
| 3 | City of London | £433,838 | £830,233 | 91.4% |
| 4 | Kensington and Chelsea | £746,679 | £1,423,465 | 90.6% |
| 5 | Waltham Forest | £237,017 | £434,091 | 83.2% |
| 6 | Haringey | £305,510 | £557,585 | 82.5% |
| 7 | Lewisham | £229,655 | £409,485 | 78.3% |
| 8 | Southwark | £289,668 | £514,058 | 77.5% |
| 9 | Shetland Islands | £91,739 | £161,984 | 76.6% |
| 10 | Camden | £466,486 | £818,769 | 75.5% |
At the other end of the spectrum, house prices in Northern Ireland have dropped by an average of 42.0% since 2007, with house prices in Causeway Coast and Glens – the most northerly region – falling by an average of 44.15%, from £227,535 in 2007 to £127,081 in 2017.
Top 10 regions for house price declines between 2007-17
|
Position |
Region | Average house price – 2007 | Average house price – 2017 |
Decrease |
| 1 | Causeway Coast and Glens | £227,535 | £127,081 | 44.2% |
| 2 | Armagh Banbridge and Craigavon | £201,097 | £112,532 | 44.0% |
| 3 | Lisburn and Castlereagh | £257,066 | £146,662 | 43.0% |
| 4 | North Down and Ards | £249,368 | £142,807 | 42.7% |
| 5 | Mid and East Antrim | £200,024 | £114,932 | 42.5% |
| 6 | Belfast | £200,145 | £115,868 | 42.1% |
| 7 | Newry Mourne and Down | £224,915 | £130,322 | 42.1% |
| 8 | Fermanagh and Omagh | £191,061 | £112,358 | 41.3% |
| 9 | Mid Ulster | £211,064 | £124,950 | 40.8% |
| 10 | Antrim and Newtownabbey | £215,836 | £127,920 | 40.7% |
Alex Gosling, the CEO of HouseSimple, says: “House prices in the UK suffered a record drop in 2008, recovering only in 2010, but the Shetland Islands weathered this storm. Property prices on the islands plateaued between 2011 and 2013, but increases have been fairly consistent over the past decade.
“Today, you can buy a house in Shetland for less than a third of what you’d pay in a London borough like Hackney, or around £60,000 less than in Edinburgh. This is why it’s such an attractive area for buyers looking for a slower pace of life or even a second home.”
He adds: “Nowhere in the UK was hit harder by the 2008 downturn than Northern Ireland. Prices did not recover until 2014 and, even now, are only worth 58% of what they were worth at their peak in 2007.”
Could the Shetland Islands be the perfect spot for your next property investment?


