Home » Uncategorised »
Hometrack Index Showing Stable House Price Growth
This article is an external press release originally published on the Landlord News website, which has now been migrated to the Just Landlords blog.

Hometrack, the property market analyst, has released their House Price Index for February 2018, showing house price growth to be continuing a stable buoyancy.
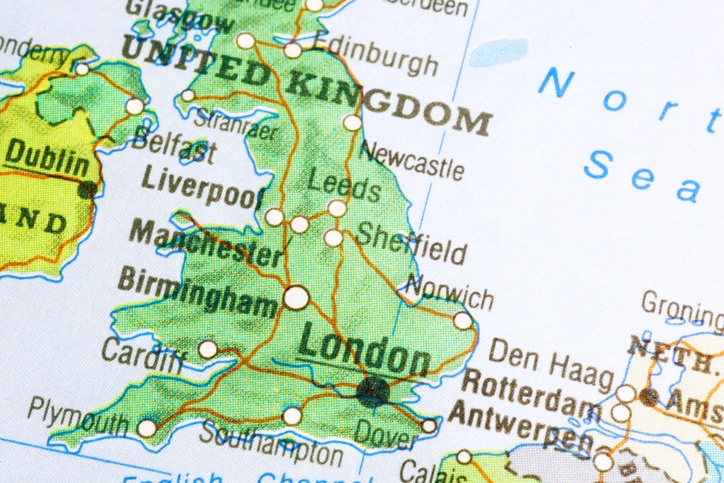
Overall, UK city house price inflation is running at 5.2%, with London houses prices increasing 1% per annum, showing negative growth in 42% of postcodes. The February Index is showing a divergence in growth for house prices between the south of England and regional cities.
Of the 20 cities covered by the index, half of them are showing a higher annual growth than what was recorded a year ago. Specifically, Edinburgh, Liverpool, Leicester, Birmingham and Manchester have registered more than 7% growth per annum.
Graham Davidson, managing director of buy to let specialist, Sequre Property Investment, has said: “The latest Hometrack report cements what we’ve been saying for several years, that the north is best to invest.
“Whilst many investors are turning their back on London and the south due to very poor rental yield returns and little or even negative capital growth, the north has been flourishing. Deals in northern cities are far stronger; for example, an investor can pick up a 2-bedroom apartment in Manchester for around £98,000 generating a 22.3% return on cash invested, financials you simply wouldn’t find in the south.
Those who were quick to catch on to northern buy to let 4 years ago could now be sitting on returns in excess of 230%, demonstrating the strength of the market in the North West. For savvy investors, the north is the place to be. You just need to know where to look.”

Hometrack Index Showing Stable House Price Growth
Founder and CEO of Emoov.co.uk, Russell Quirk, has commented: “The appeal of city living continues to ensure that house price growth across the nation’s major cities remains buoyant, despite wider market conditions.
“This imbalance of supply to meet demand in the more densely populated areas of the market has seen them buck the trend of a slower start to the year, to enjoy a greater rate of annual growth than this time last year.”
There is a slowing of growth amongst certain cities compared to a year ago, with Bristol, Southampton and London showing the greatest slowdown. In particular, London’s annual growth rate has slowed to 1%, down from 4.3%. This is the lowest annual rate London has seen since 2011. Average prices have increased over the last 3 months by 0.4%, which is a small amount in comparison to the 5% growth recorded per quarter in 2014.
Quirk also said: “Unfortunately for the capital the much higher price of getting on the ladder, and the greater degree of buyer uncertainty as a result, has seen London remain one of the ugly ducklings of city living where market performance is concerned.
However, as we’ve seen over the years, the popularity of the London market is cyclical and while it may have fallen out of favour for the time being, this cool in price growth is unlikely to prevail as the year plays out and it is highly unlikely we will see a market crash of any shape or form.
London is still viewed by many as the pinnacle of homeownership in the UK and while the growing political tensions with Russia will do little to help London’s prime central market, vast pockets of the capital remain very popular among buyers.”
Further information from the February Hometrack House Price Index shows the highest coverage of price falls since 2008. Growth among London city postcodes has varied between positive to negative since 1996, but currently we are seeing the highest negative growth since the global financial crisis. Most of the times London has seen falling prices have been due to economic and other such external factors.
Hometrack expect the number of markets with falling house prices to increase as the year goes on, due to buyers accepting lower prices in order to successfully complete sales.


